Built for the decisions that matter most
Each module is designed around the real questions retail executives and expansion teams face every day.
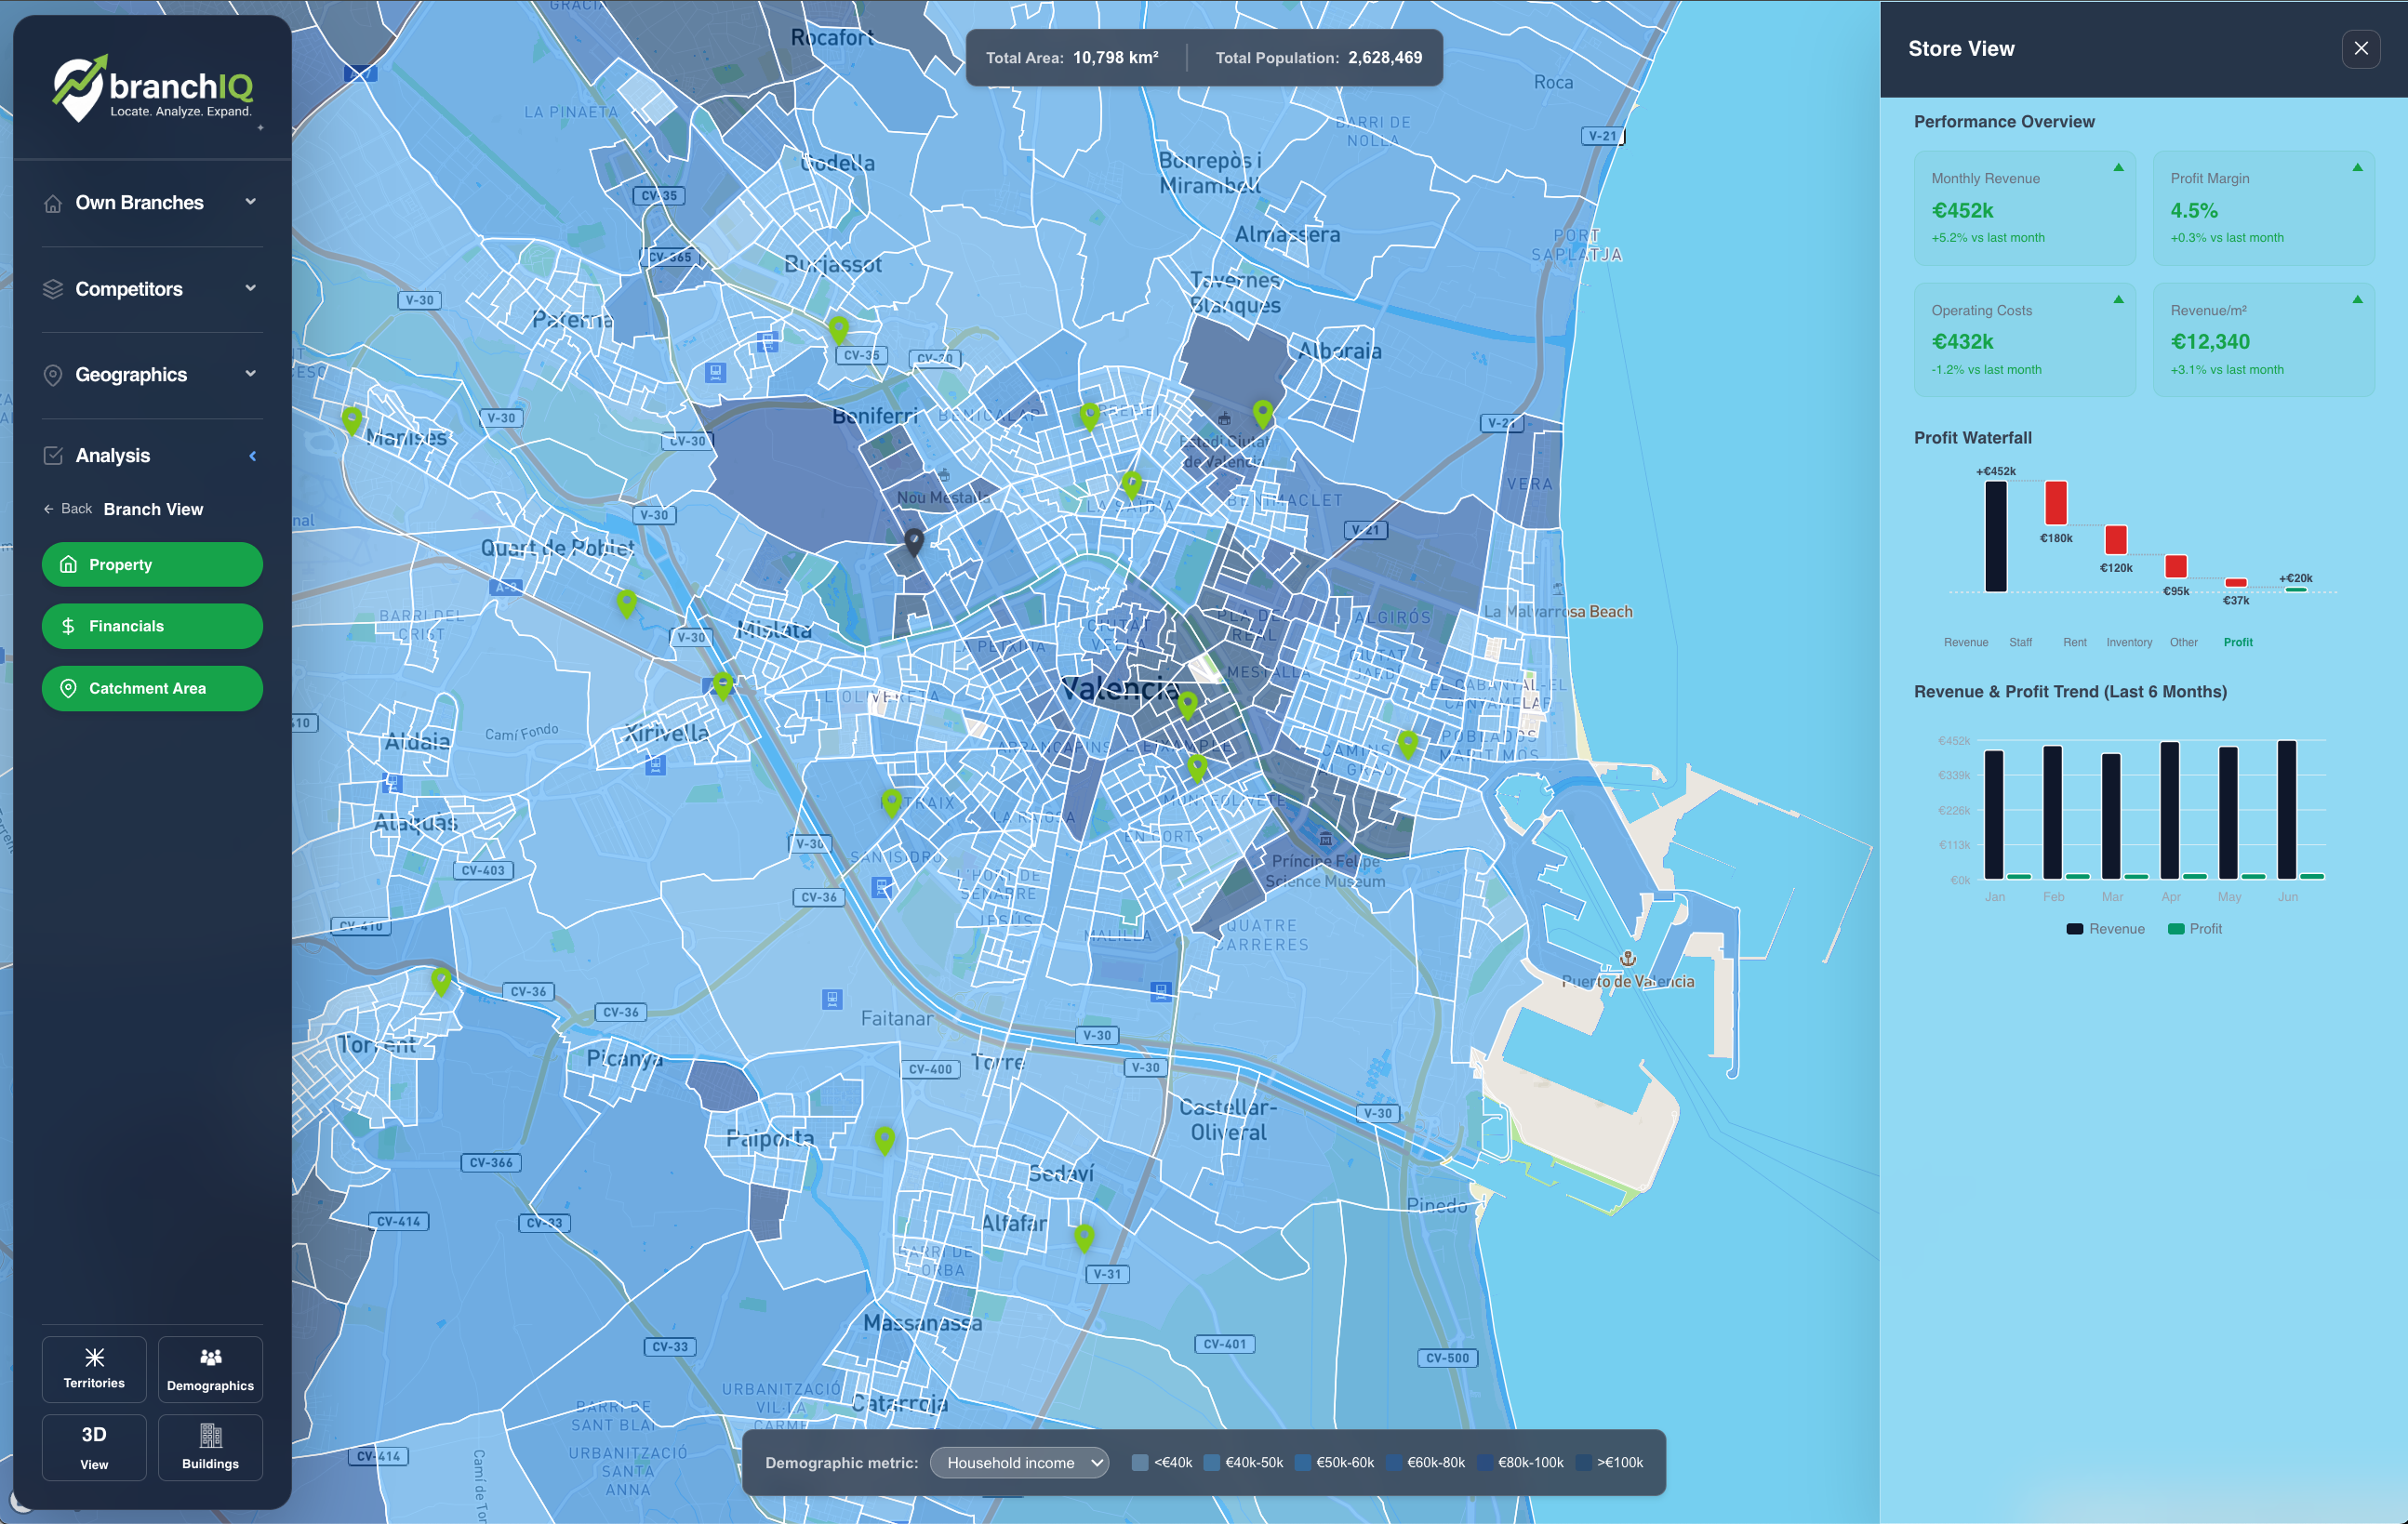
🏪 Store Performance & Financials
Click any branch on the map to open a full performance dossier. Understand not just revenue — but the economic and demographic context driving it.
- Monthly revenue, profit margin, operating costs, and revenue per m²
- Profit waterfall: revenue → staff → rent → inventory → other → net profit
- 6-month revenue & profit trends with visual sparklines
- Google ratings and sentiment analysis across the network
- Property register integration (cadastral data, store area, opening hours)
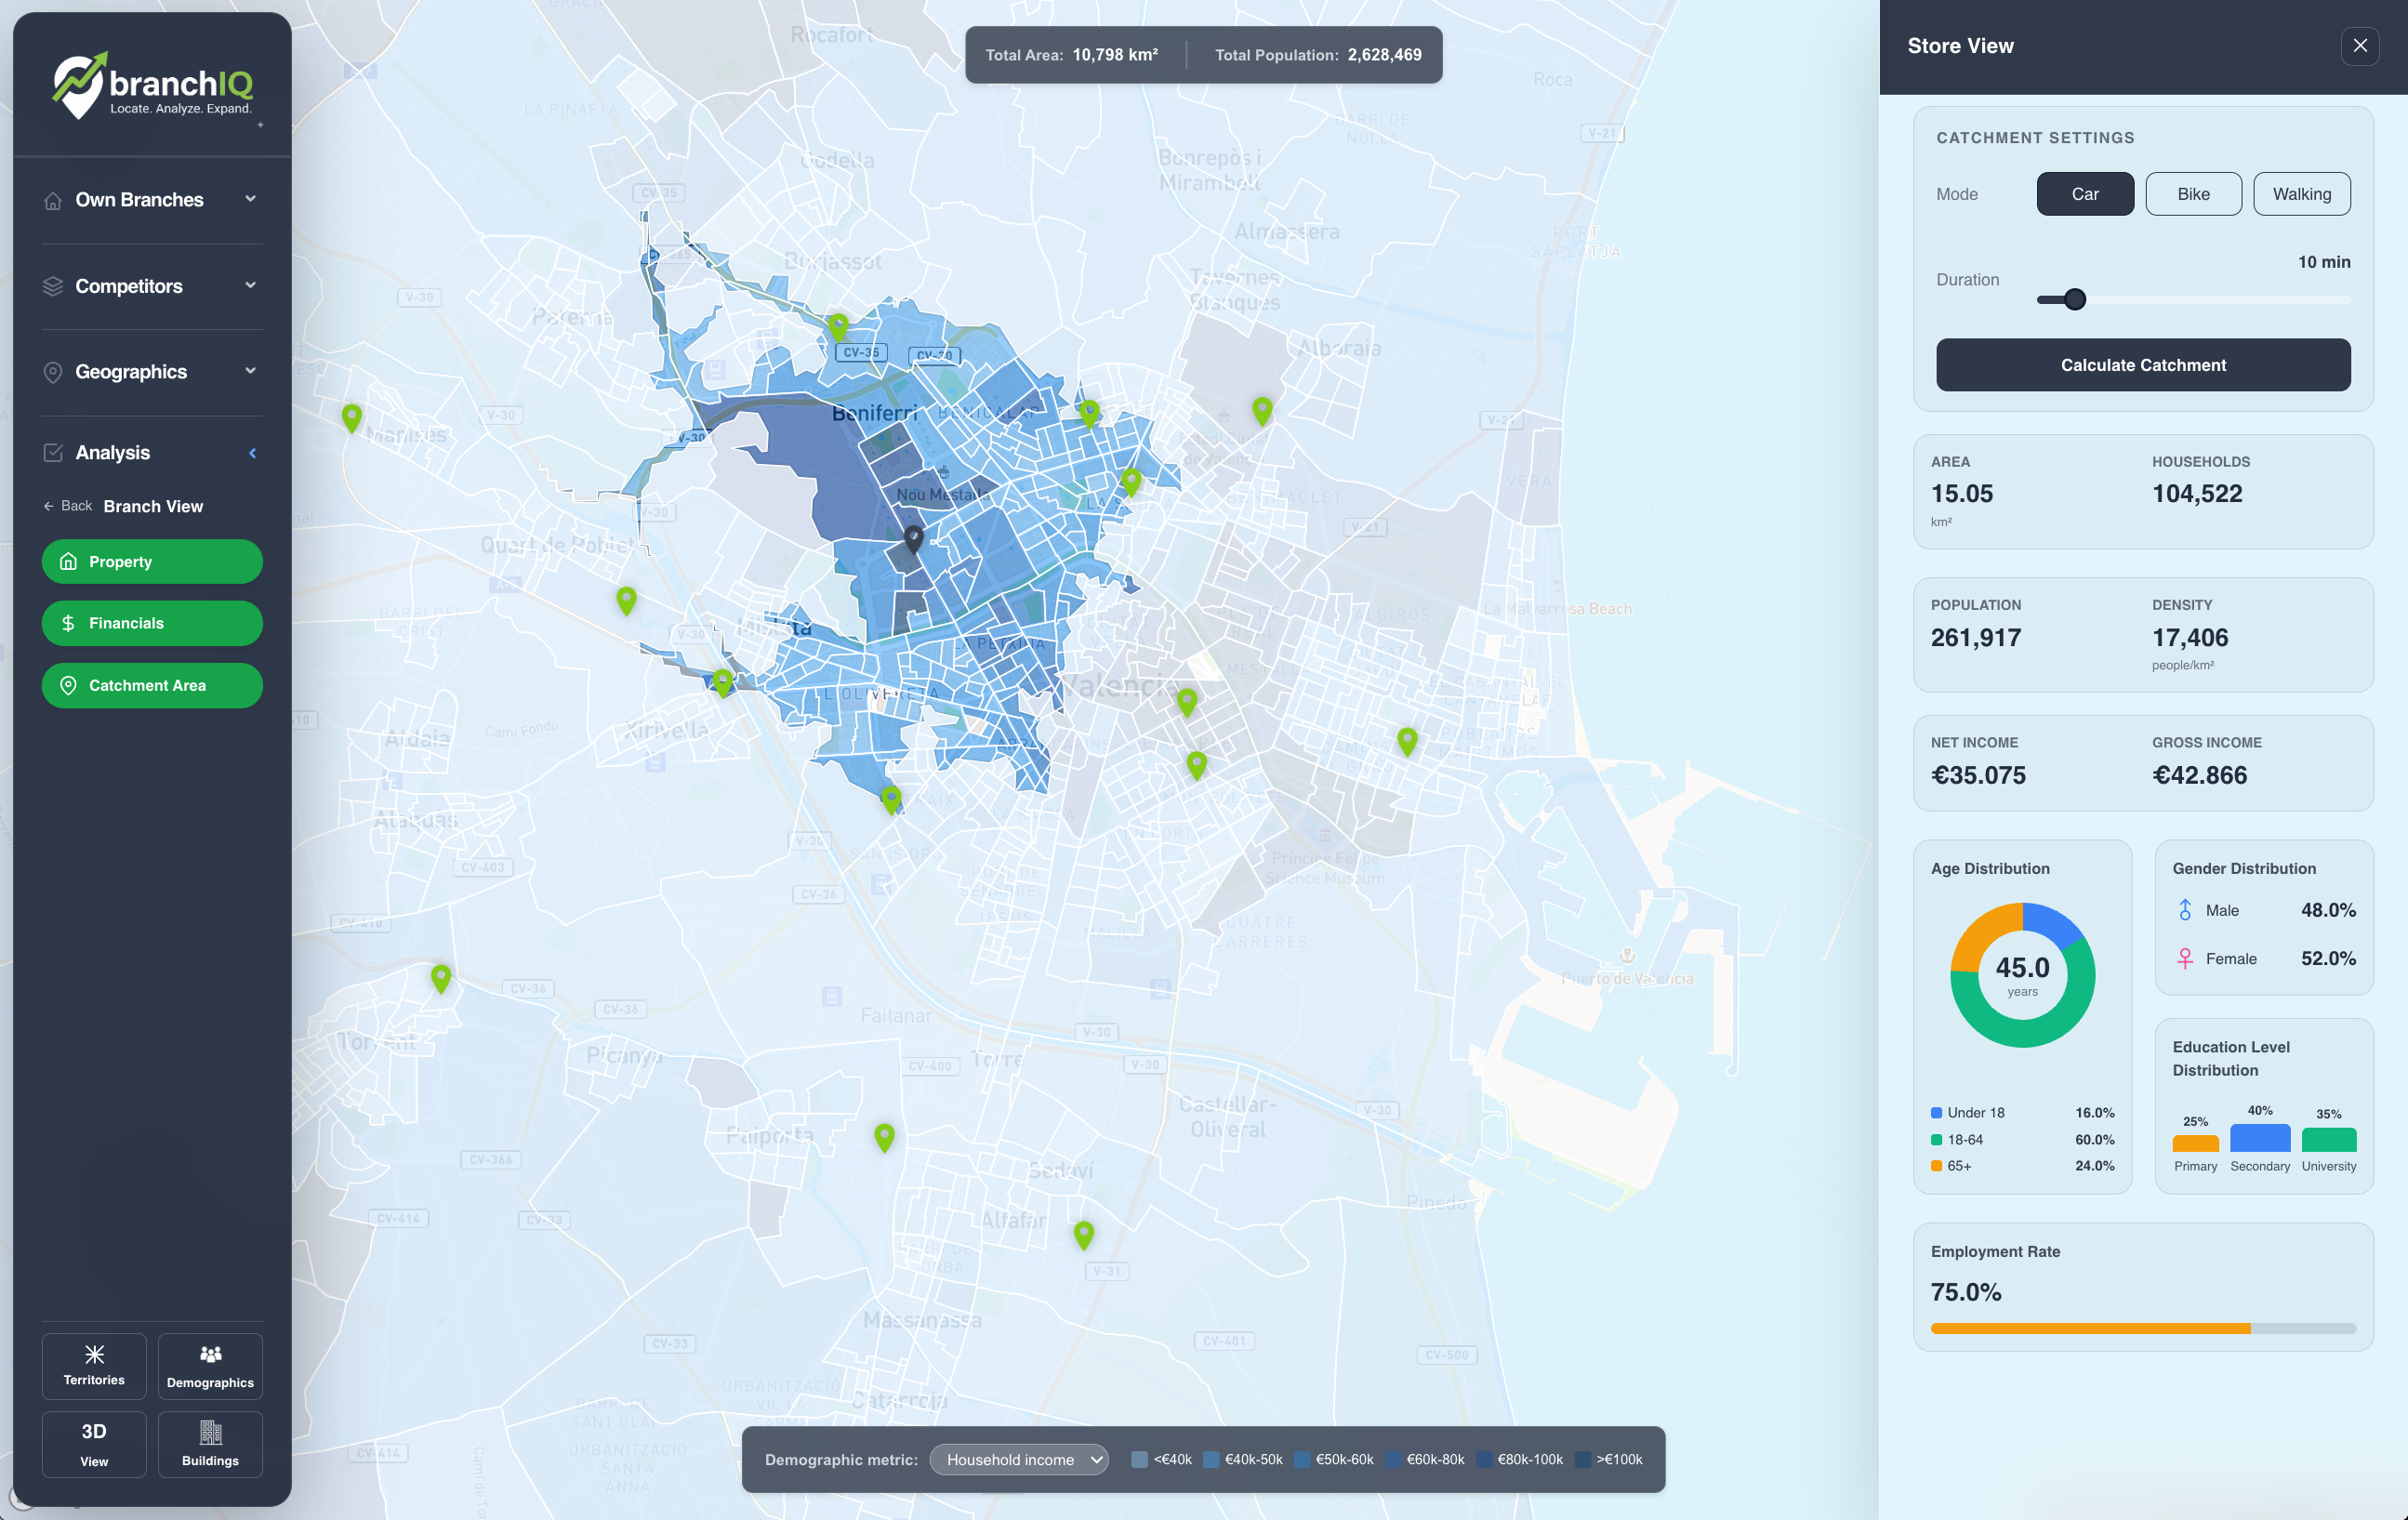
🗺️ Catchment Area Intelligence
Generate real catchment areas using driving, cycling, or walking profiles. Then enrich them with granular demographic data — income, age, education, employment — to understand who your customers really are.
- Proprietary catchment engine with car, bike, and walking profiles
- Configurable travel-time duration (5–60 minutes)
- Population, density, and household estimates within catchment
- Age pyramid, gender split, education level, employment rate
- Net and gross income per person and per household
- Side-by-side catchment comparison between any two branches
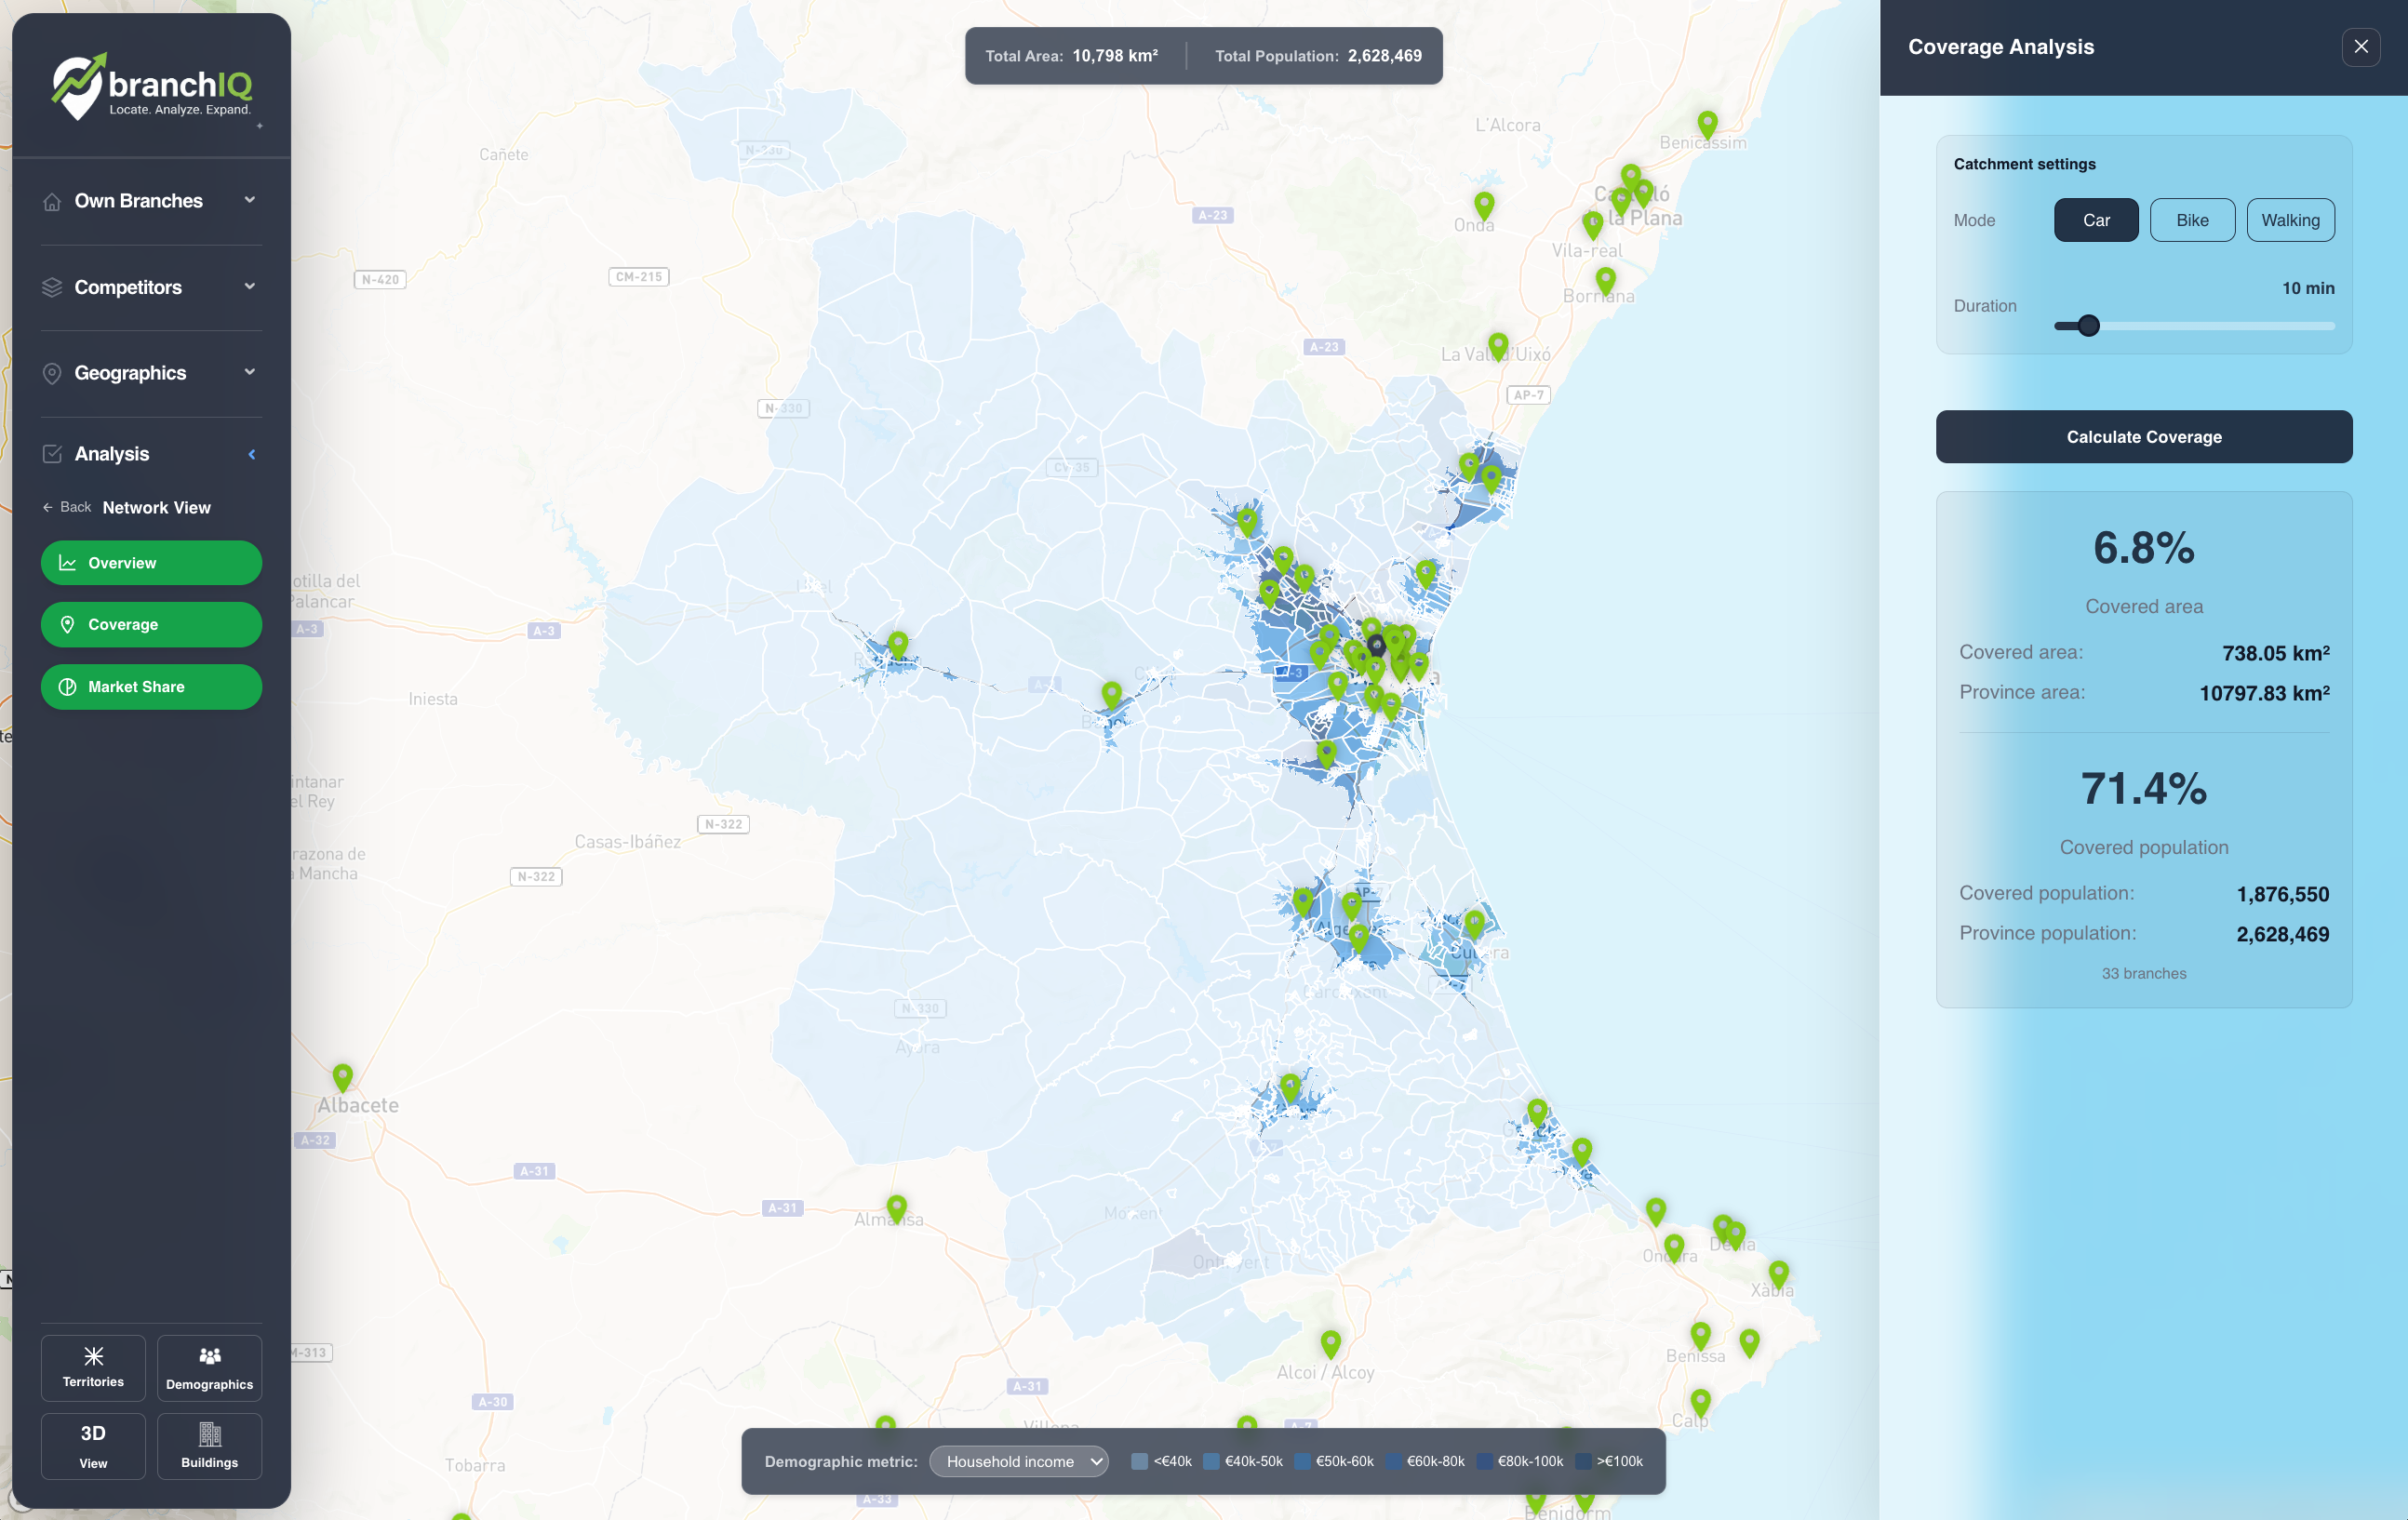
📡 Network Coverage
Scale the catchment view from a single branch to your entire network. See the total area, population, and demographics your network currently reaches — and where the gaps are.
- Aggregate catchment coverage across all branches in one view
- Total area and population served by the network
- Coverage density: identify over-served and under-served zones
- Network-wide demographic profile of your reachable population
- Gap analysis: uncovered area and population at a glance
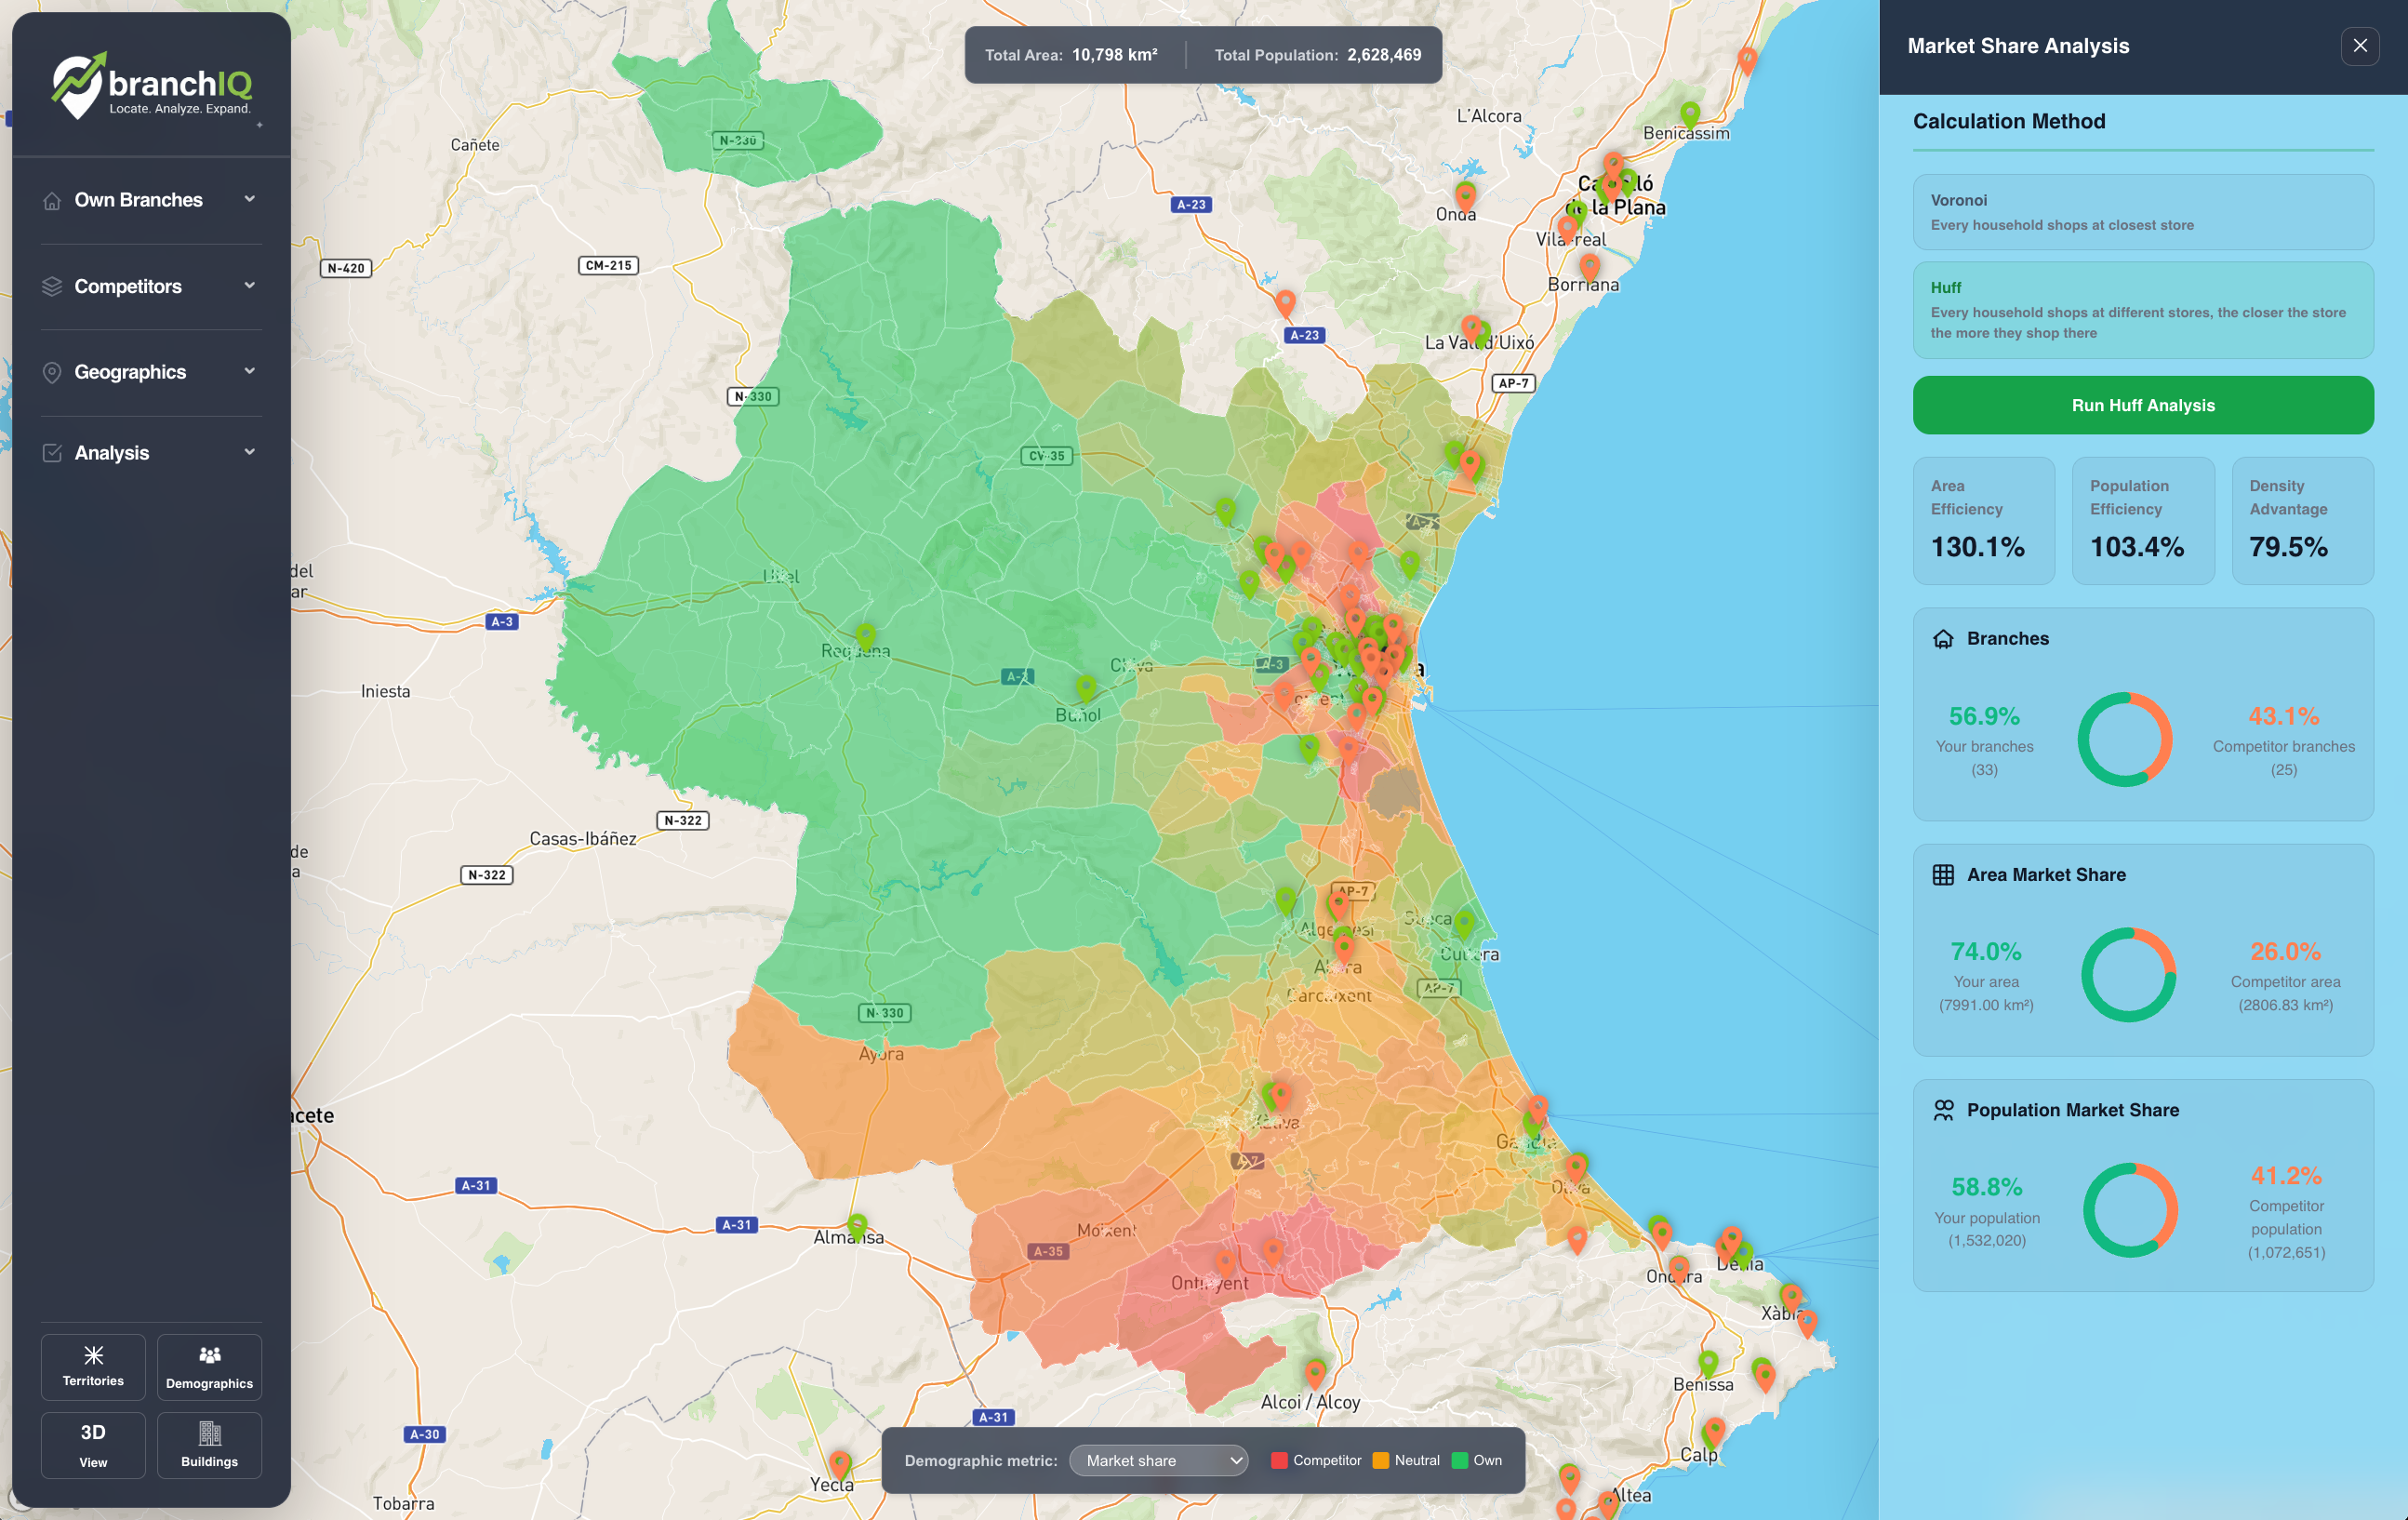
📈 Market Share Analysis
Go beyond simple counts. Model true competitive dynamics with Voronoi territory splits or probabilistic Huff gravity models — and see exactly where you're winning or losing share.
- Voronoi: nearest-store assignment for every census section
- Huff: gravity-based probability model weighted by distance and store size
- Area, population, and branch efficiency KPIs with donut visualizations
- Own vs. competitor territory comparison on the map
- Efficiency indices: area/branch, population/branch, density advantage
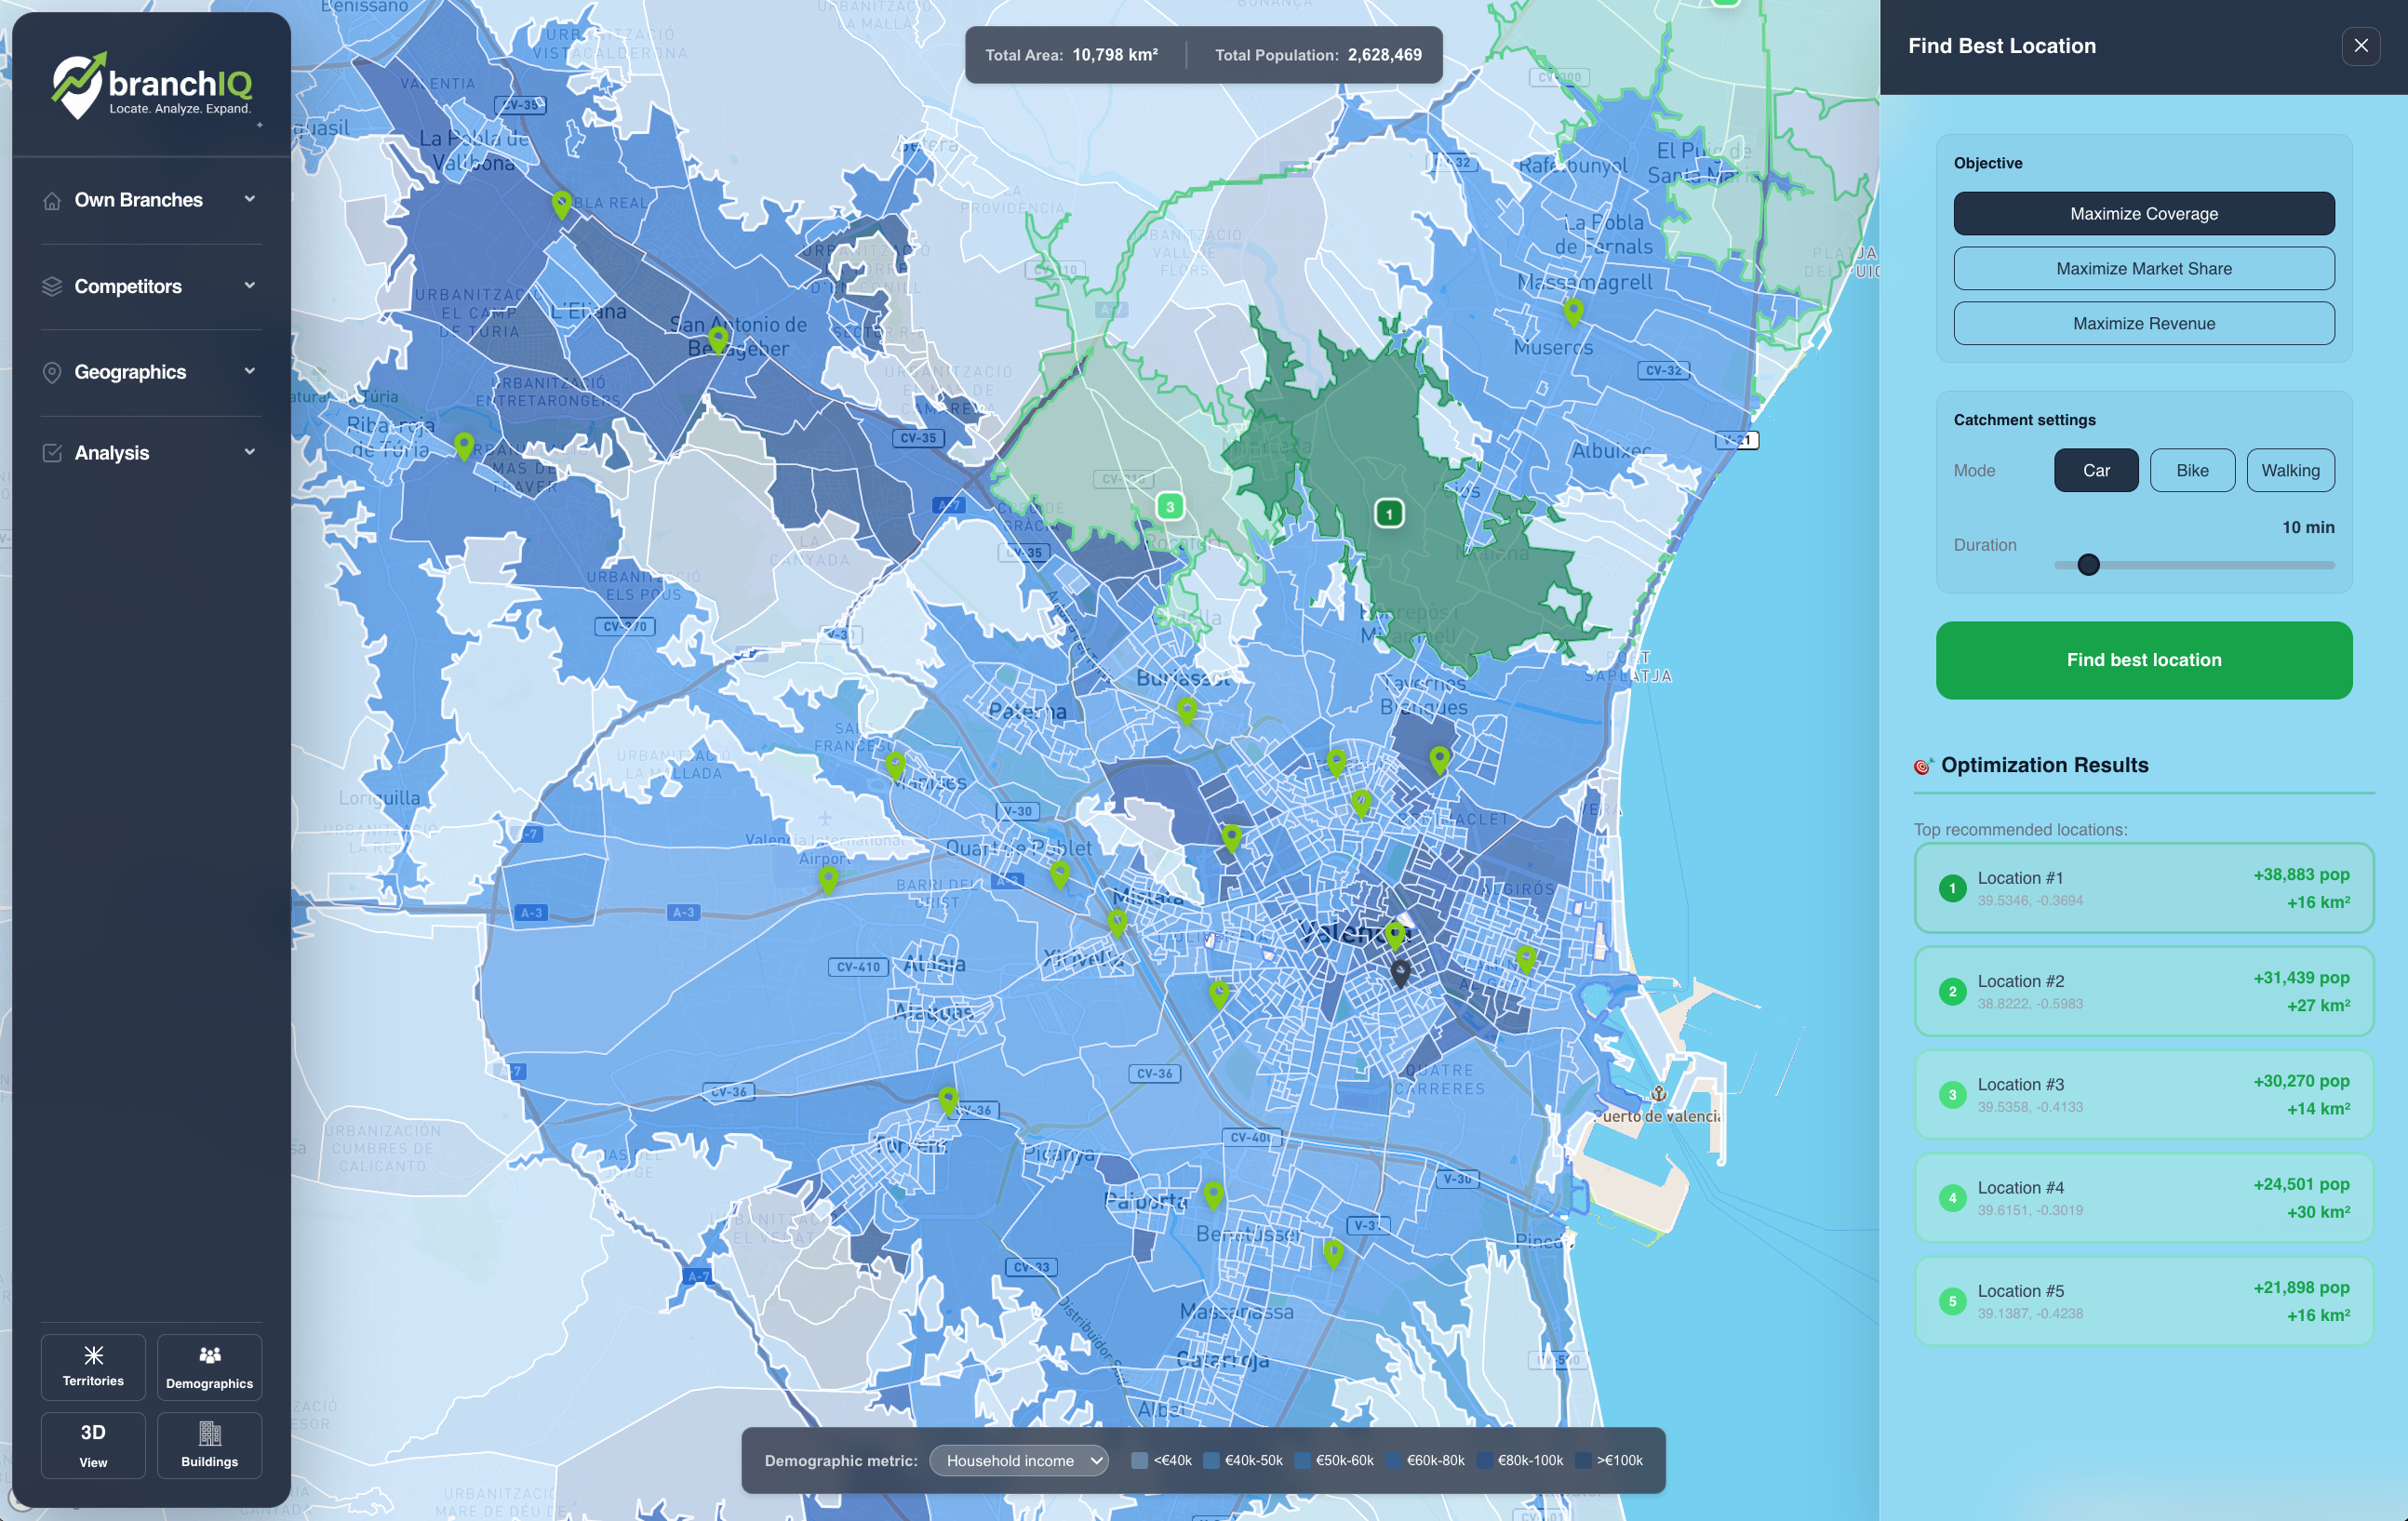
🚀 Expansion & White Spots
Find the next best location — not by intuition, but by data. BranchIQ identifies underserved areas, ranks candidate sites, and simulates the network impact before you commit.
- White spot detection with adjustable density and population thresholds
- Coverage analysis: % of area and population currently served
- Best-location optimizer: maximize coverage, market share, or revenue
- Revenue cannibalization and redistribution simulation
- Branch closure simulation: model revenue flows to surviving stores